The offerings sold report is going to provide a breakdown of the different offerings that were sold in a time frame. This report gives the total number of sales that took place and the money that was brought in from those sales.
Select Reports and then select Offerings Sold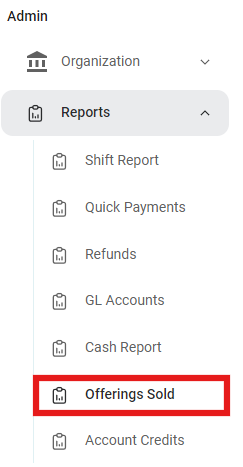
Once in the offerings sold report first filter by dates, you will see several quick buttons that filter to a designated time period. If you need to look at a custom range you will select specific dates, make sure you leave the option of between and then set your dates and select add filter.
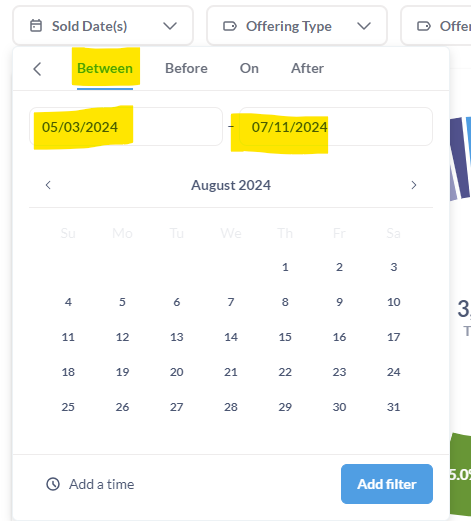
Once you have filtered the date you will see the pie charts with a summary at the top of the page and below that you will see the detail which tells you the name of the offering sold, the quantity sold, and total income.
Was this article helpful?
That’s Great!
Thank you for your feedback
Sorry! We couldn't be helpful
Thank you for your feedback
Feedback sent
We appreciate your effort and will try to fix the article